Validation
LLMServingSim is validated end-to-end against real vLLM on the
bundled (hardware, model) combos. The numbers below come from
running a 300-request ShareGPT replay through both vLLM v0.19.0 and
the simulator on RTXPRO6000, then comparing the per-request and
per-tick metrics with python -m bench validate.
Want to validate your own change? See For Contributors → Validating your changes for the regression workflow.
Setup
| Knob | Value |
|---|---|
| Workload | 300 ShareGPT-derived requests, ~10 sps Poisson arrivals |
| Hardware | RTXPRO6000 (single node, profile bundle in profiler/perf/RTXPRO6000/) |
| vLLM version | v0.19.0 (the pin used by the bench container) |
| Block size | 16 |
| Engine flags | Defaults except where the cluster config dictates otherwise |
| Cluster configs | bench/examples/configs/<model>.json |
Inputs and outputs (vLLM token IDs, sampling params, per-request
timings) are pinned via bench's strict-replay path so both runs
process exactly the same prompts in the same order.
Headline numbers
Mean error vs. real vLLM, per metric, on the three currently bundled configurations:
| Model | Parallelism | TTFT mean | TPOT mean | Latency mean |
|---|---|---|---|---|
| Llama-3.1-8B | TP=1 dense | -0.3% | +0.7% | +0.4% |
| Qwen3-32B | TP=2 dense | +2.4% | +1.7% | +2.0% |
| Qwen3-30B-A3B-Instruct-2507 | DP=2 × EP=2 MoE | -1.5% | +1.1% | +0.9% |
Across all three, TTFT / TPOT / latency means stay within ~2.5%
of vLLM, and the DP+EP MoE path tracks vLLM as tightly as the
dense TP path. Per-percentile numbers (P50 / P90 / P95 / P99) are in
the per-model summary.txt files under
bench/examples/.
Per-model results
Llama-3.1-8B (TP=1 dense)
Throughput timeline, vLLM (orange) vs. simulator (blue):
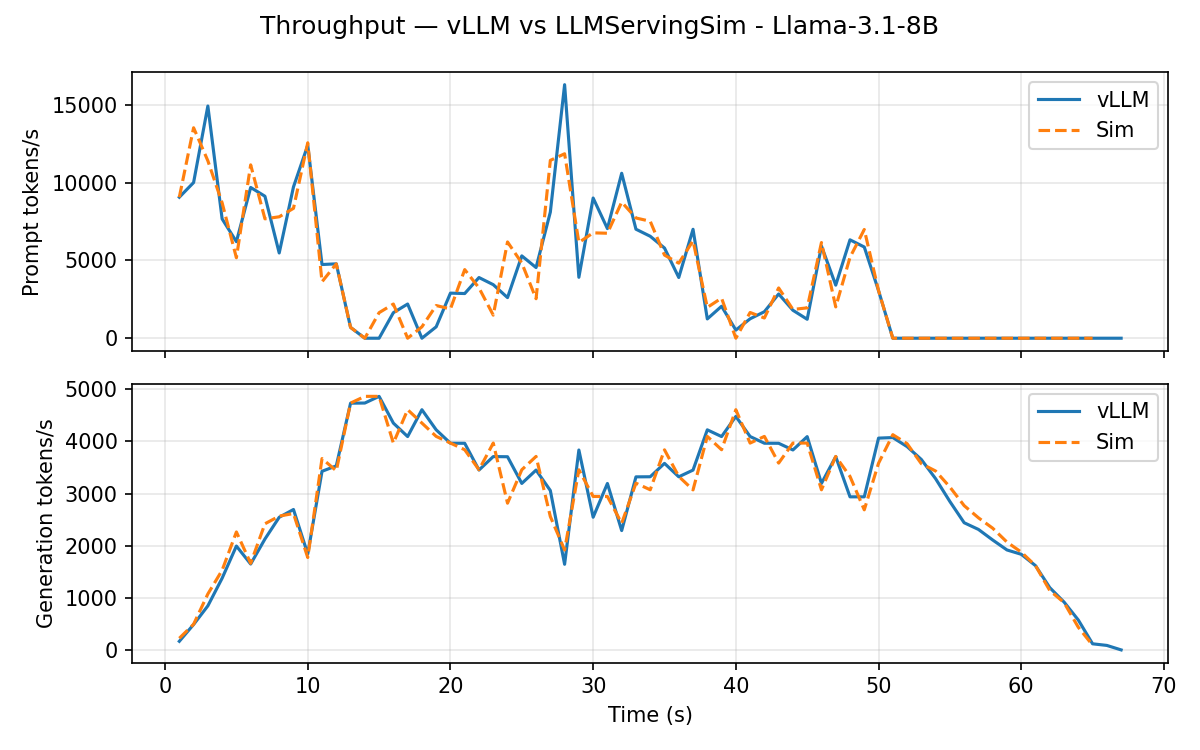
Headline error vs. vLLM:
| Metric | vLLM | Sim | Diff |
|---|---|---|---|
| TTFT mean | 7.10 s | 7.07 s | -0.3% |
| TTFT P99 | 19.76 s | 19.96 s | +1.0% |
| TPOT mean | 32.5 ms | 32.7 ms | +0.7% |
| TPOT P99 | 37.3 ms | 38.1 ms | +2.1% |
| Latency mean | 28.20 s | 28.31 s | +0.4% |
| Latency P99 | 37.64 s | 37.96 s | +0.8% |
Single-instance dense Llama is the simplest configuration. The simulator matches TTFT mean to within 0.3% and tracks TPOT and end-to-end latency within ~1%.
Qwen3-32B (TP=2 dense)
Throughput timeline:
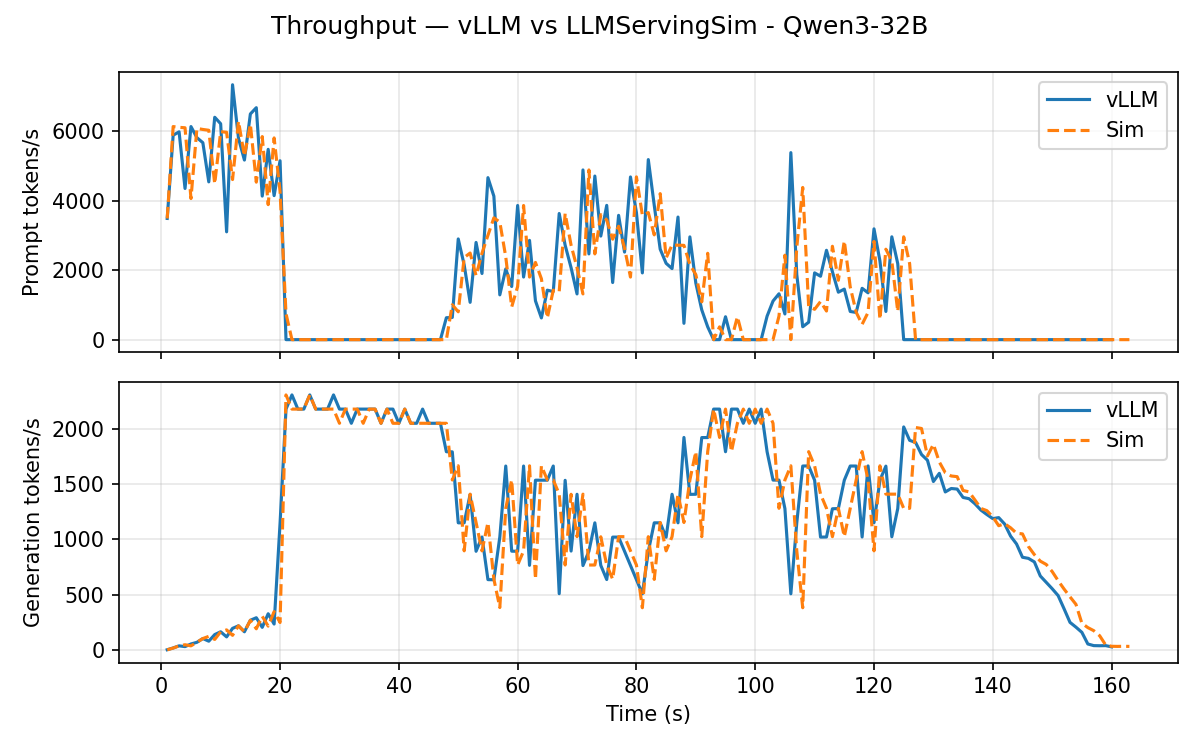
Headline error vs. vLLM:
| Metric | vLLM | Sim | Diff |
|---|---|---|---|
| TTFT mean | 36.91 s | 37.81 s | +2.4% |
| TTFT P99 | 93.35 s | 95.25 s | +2.0% |
| TPOT mean | 80.3 ms | 81.7 ms | +1.7% |
| TPOT P99 | 97.1 ms | 99.2 ms | +2.2% |
| Latency mean | 90.41 s | 92.23 s | +2.0% |
| Latency P99 | 126.34 s | 129.30 s | +2.3% |
TP=2 exercises the dense ALLREDUCE collective on o_proj /
down_proj. Means and P99s land within ~2.5%; the simulator
slightly over-predicts because per-iteration dense compute now
accounts for chunked-prefill token counts more aggressively.
Qwen3-30B-A3B-Instruct-2507 (DP=2 × EP=2 MoE)
Throughput timeline:
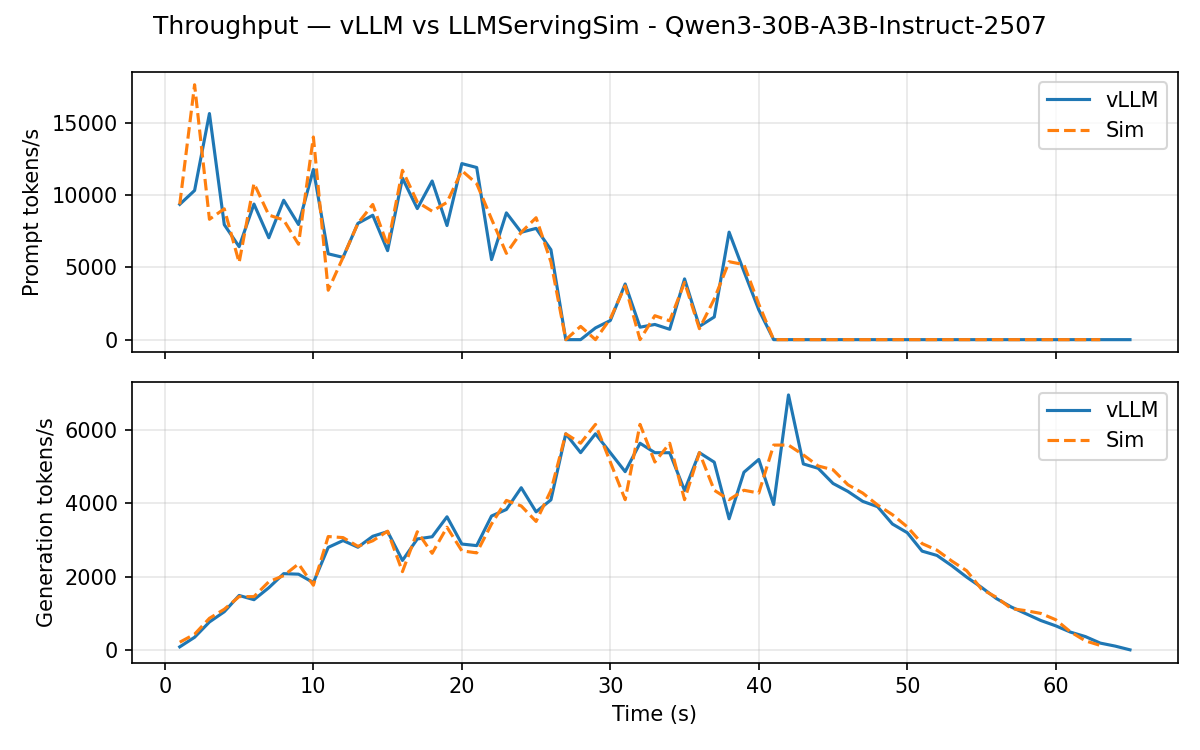
Headline error vs. vLLM:
| Metric | vLLM | Sim | Diff |
|---|---|---|---|
| TTFT mean | 1.09 s | 1.07 s | -1.5% |
| TTFT P99 | 9.59 s | 10.04 s | +4.7% |
| TPOT mean | 47.3 ms | 47.8 ms | +1.1% |
| TPOT P99 | 53.3 ms | 54.7 ms | +2.7% |
| Latency mean | 32.34 s | 32.64 s | +0.9% |
| Latency P99 | 43.90 s | 44.26 s | +0.8% |
This is the disaggregated path: data-parallel across two instances, expert-parallel within each instance, with wave-synchronized ALLTOALL on the 2D ASTRA-Sim topology. TTFT P50 is noisier (the simulator finishes very short prefills slightly faster), but means and tail latencies align with vLLM within ~3%.
Reproducing locally
The bench module ships with reproduction scripts that re-run the simulator side and re-run the comparison against the committed vLLM artifacts:
# Sim side: writes bench/examples/<model>/outputs/sim.csv
./bench/examples/run.sh Llama-3.1-8B
./bench/examples/run.sh Qwen3-32B
./bench/examples/run.sh Qwen3-30B-A3B-Instruct-2507

# Compare: writes bench/examples/<model>/validation/{summary.txt, *.png}
./bench/examples/validate.sh Llama-3.1-8B
./bench/examples/validate.sh Qwen3-32B
./bench/examples/validate.sh Qwen3-30B-A3B-Instruct-2507
The validation step regenerates the throughput / latency / requests
plots and the headline summary. To rerun vLLM itself (instead of
reusing the committed artifacts under
bench/examples/<model>/vllm/), use python -m bench run from
inside the vLLM container; see
bench/README.md
for the full layout.
What's next
- For Contributors → Validating your changes: the three-tier check (smoke → scenario → bench validate) you run before opening a PR, plus what regression to flag.
- Simulator → Reading the output: what every column in the per-request CSV means and how to derive your own metrics from it.